Week 1
Introduction to the Course & Setting Up
SOCI 269
My Journey
Cities Defined by International Migration

My Journey
Cities Defined by International Migration

My Journey
Cities Defined by International Migration

My Journey
Cities Defined by International Migration

My Research
Personal Culture of Immigrant-Origin People

Figure 8 from Karim (Karim 2024a)
My Research
Personal Culture of Immigrant-Origin People

Adaptation of results from Karim (2024b)
My Research
Exclusionary Politics

Figure 1 from Soehl and Karim (2021)
My Research
Exclusionary Politics

Karim and Lukk’s The Radicalization of Mainstream Parties in the 21st Century
The Syllabus

A Silly Example
Show the underlying code
library(marginaleffects)

avg_predictions(basic_model,
                variables = "flipper_length_mm") %>%
as_tibble() %>%
ggplot(., aes(x = flipper_length_mm, y = estimate)) +
geom_line(colour = "#b7a5d3", linewidth = 1.1) +
geom_ribbon(mapping = aes(ymin = conf.low,
                          ymax = conf.high),
            alpha = 0.1) +
theme_bw() +
labs(x = "Flippper Length (mm)",
     y = "Predicted Bill Length (mm)") +
theme(panel.grid.minor = element_blank()) 
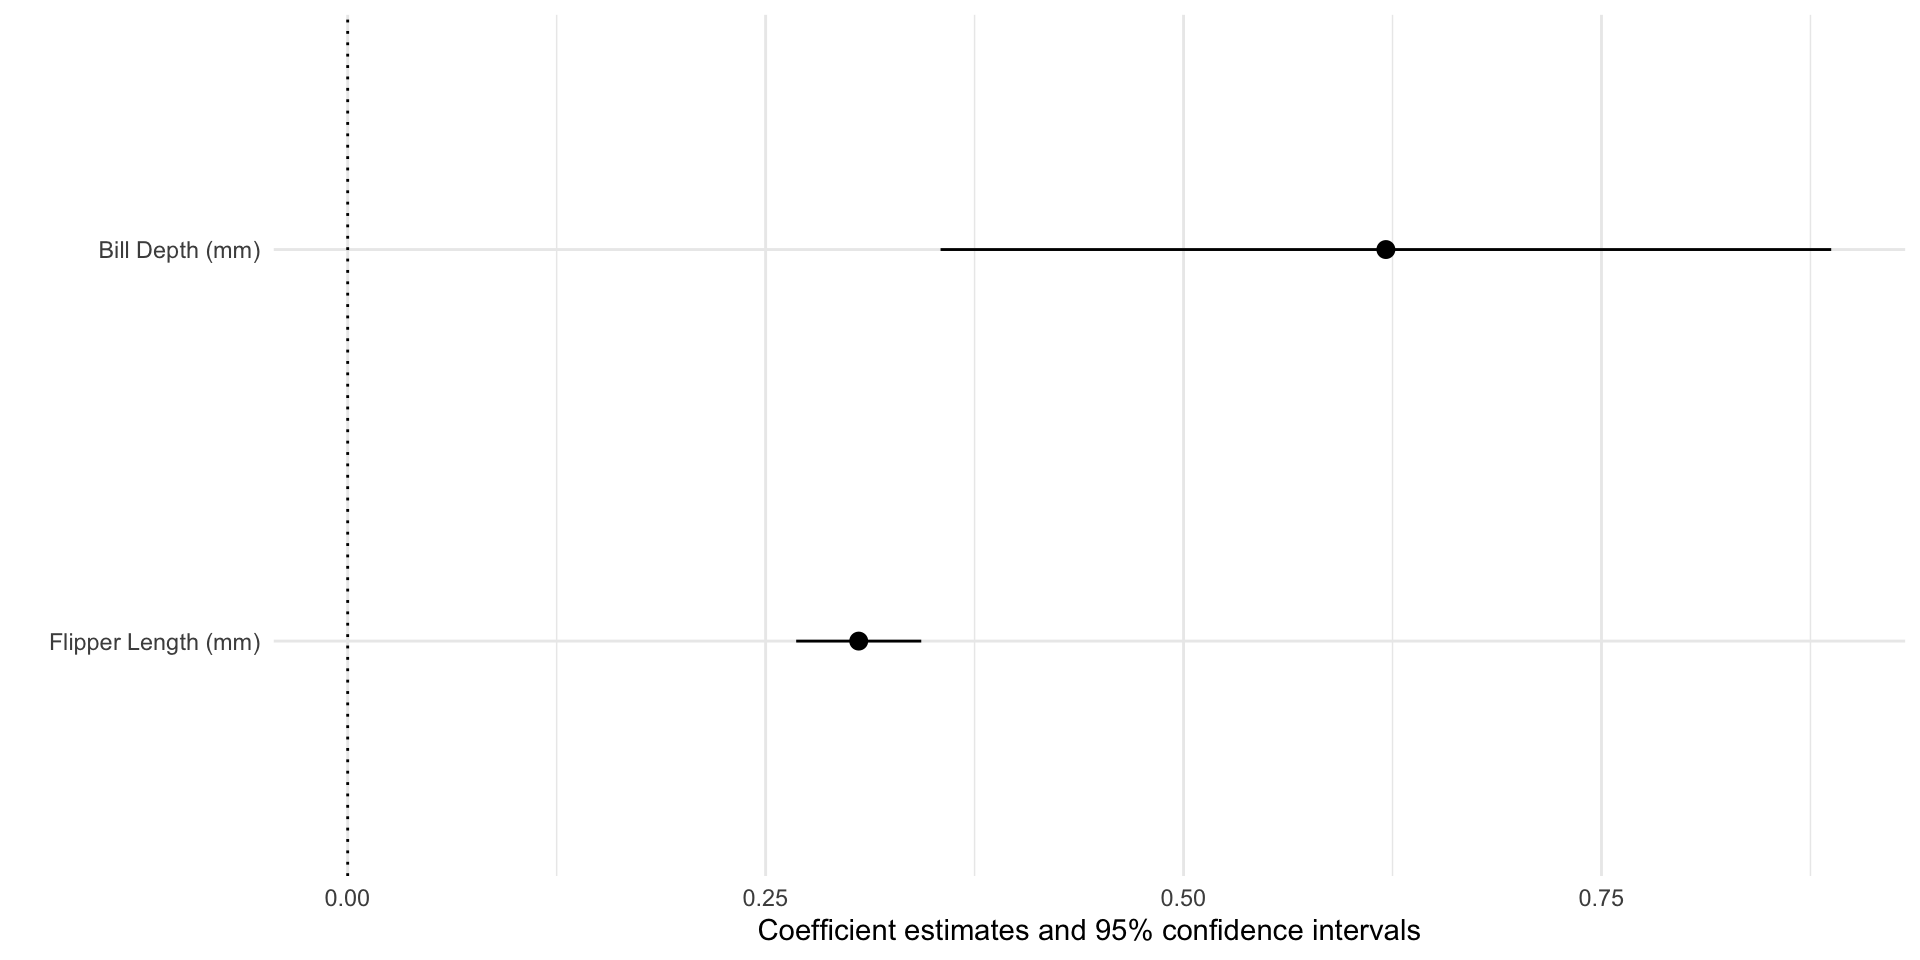
A Silly Example
Adding Another Predictor
Show the underlying code
Transcending a General Linear Reality
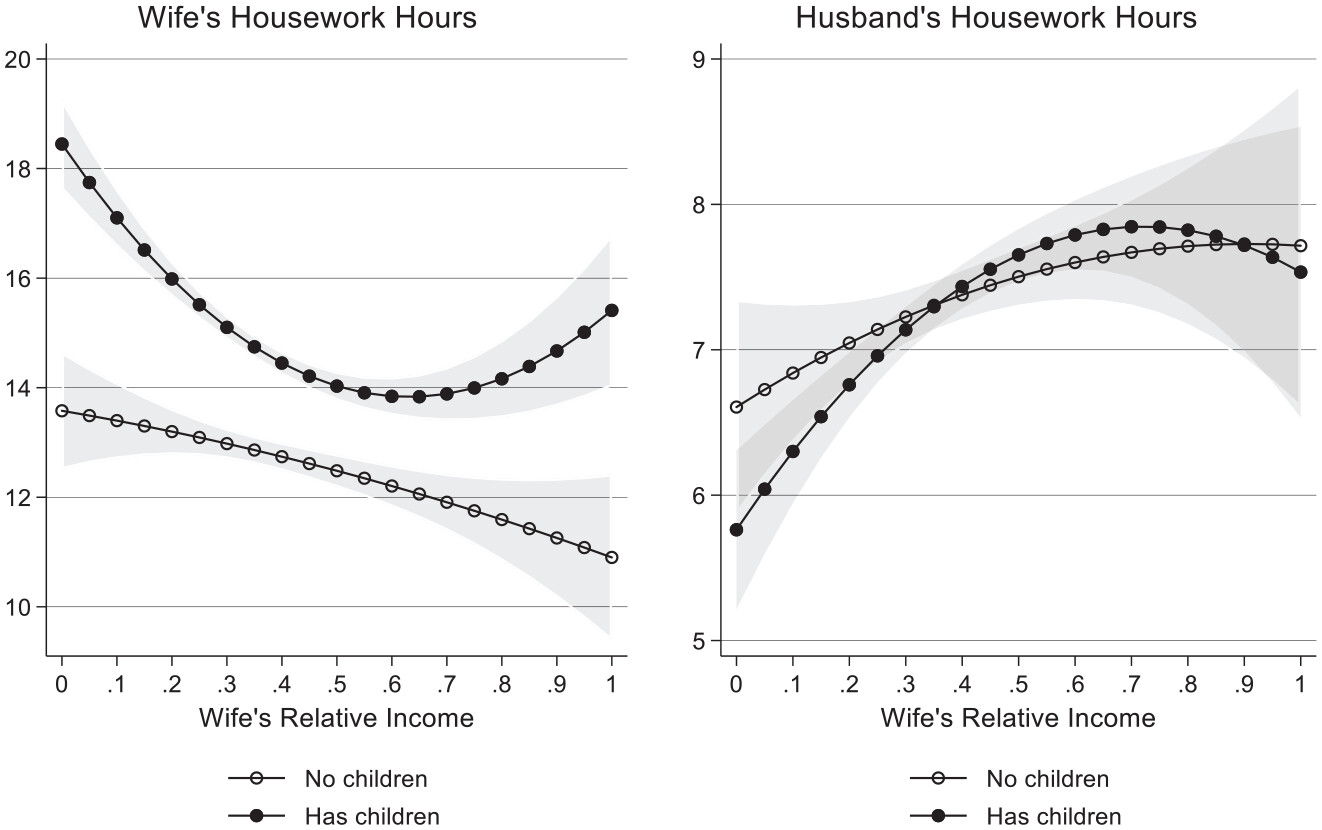
Figure 2 from Syrda (2023)
Transcending a General Linear Reality
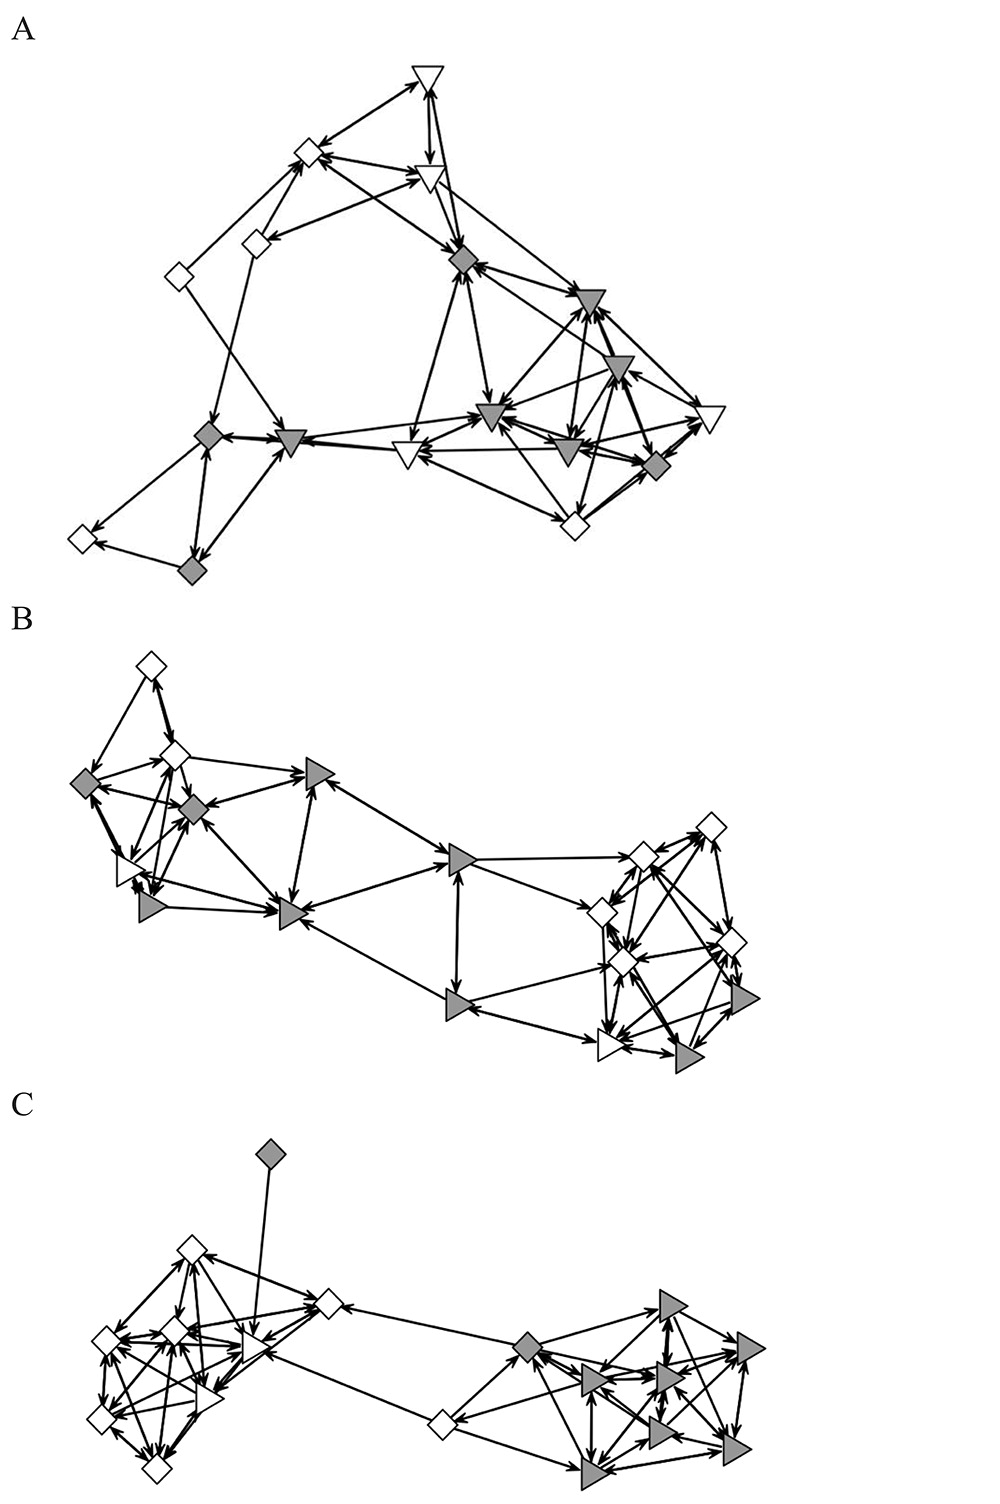
Figure 5 from Zhao (2023)
Transcending a General Linear Reality
Using Sequence Analyses (cf. Abbott 1995)
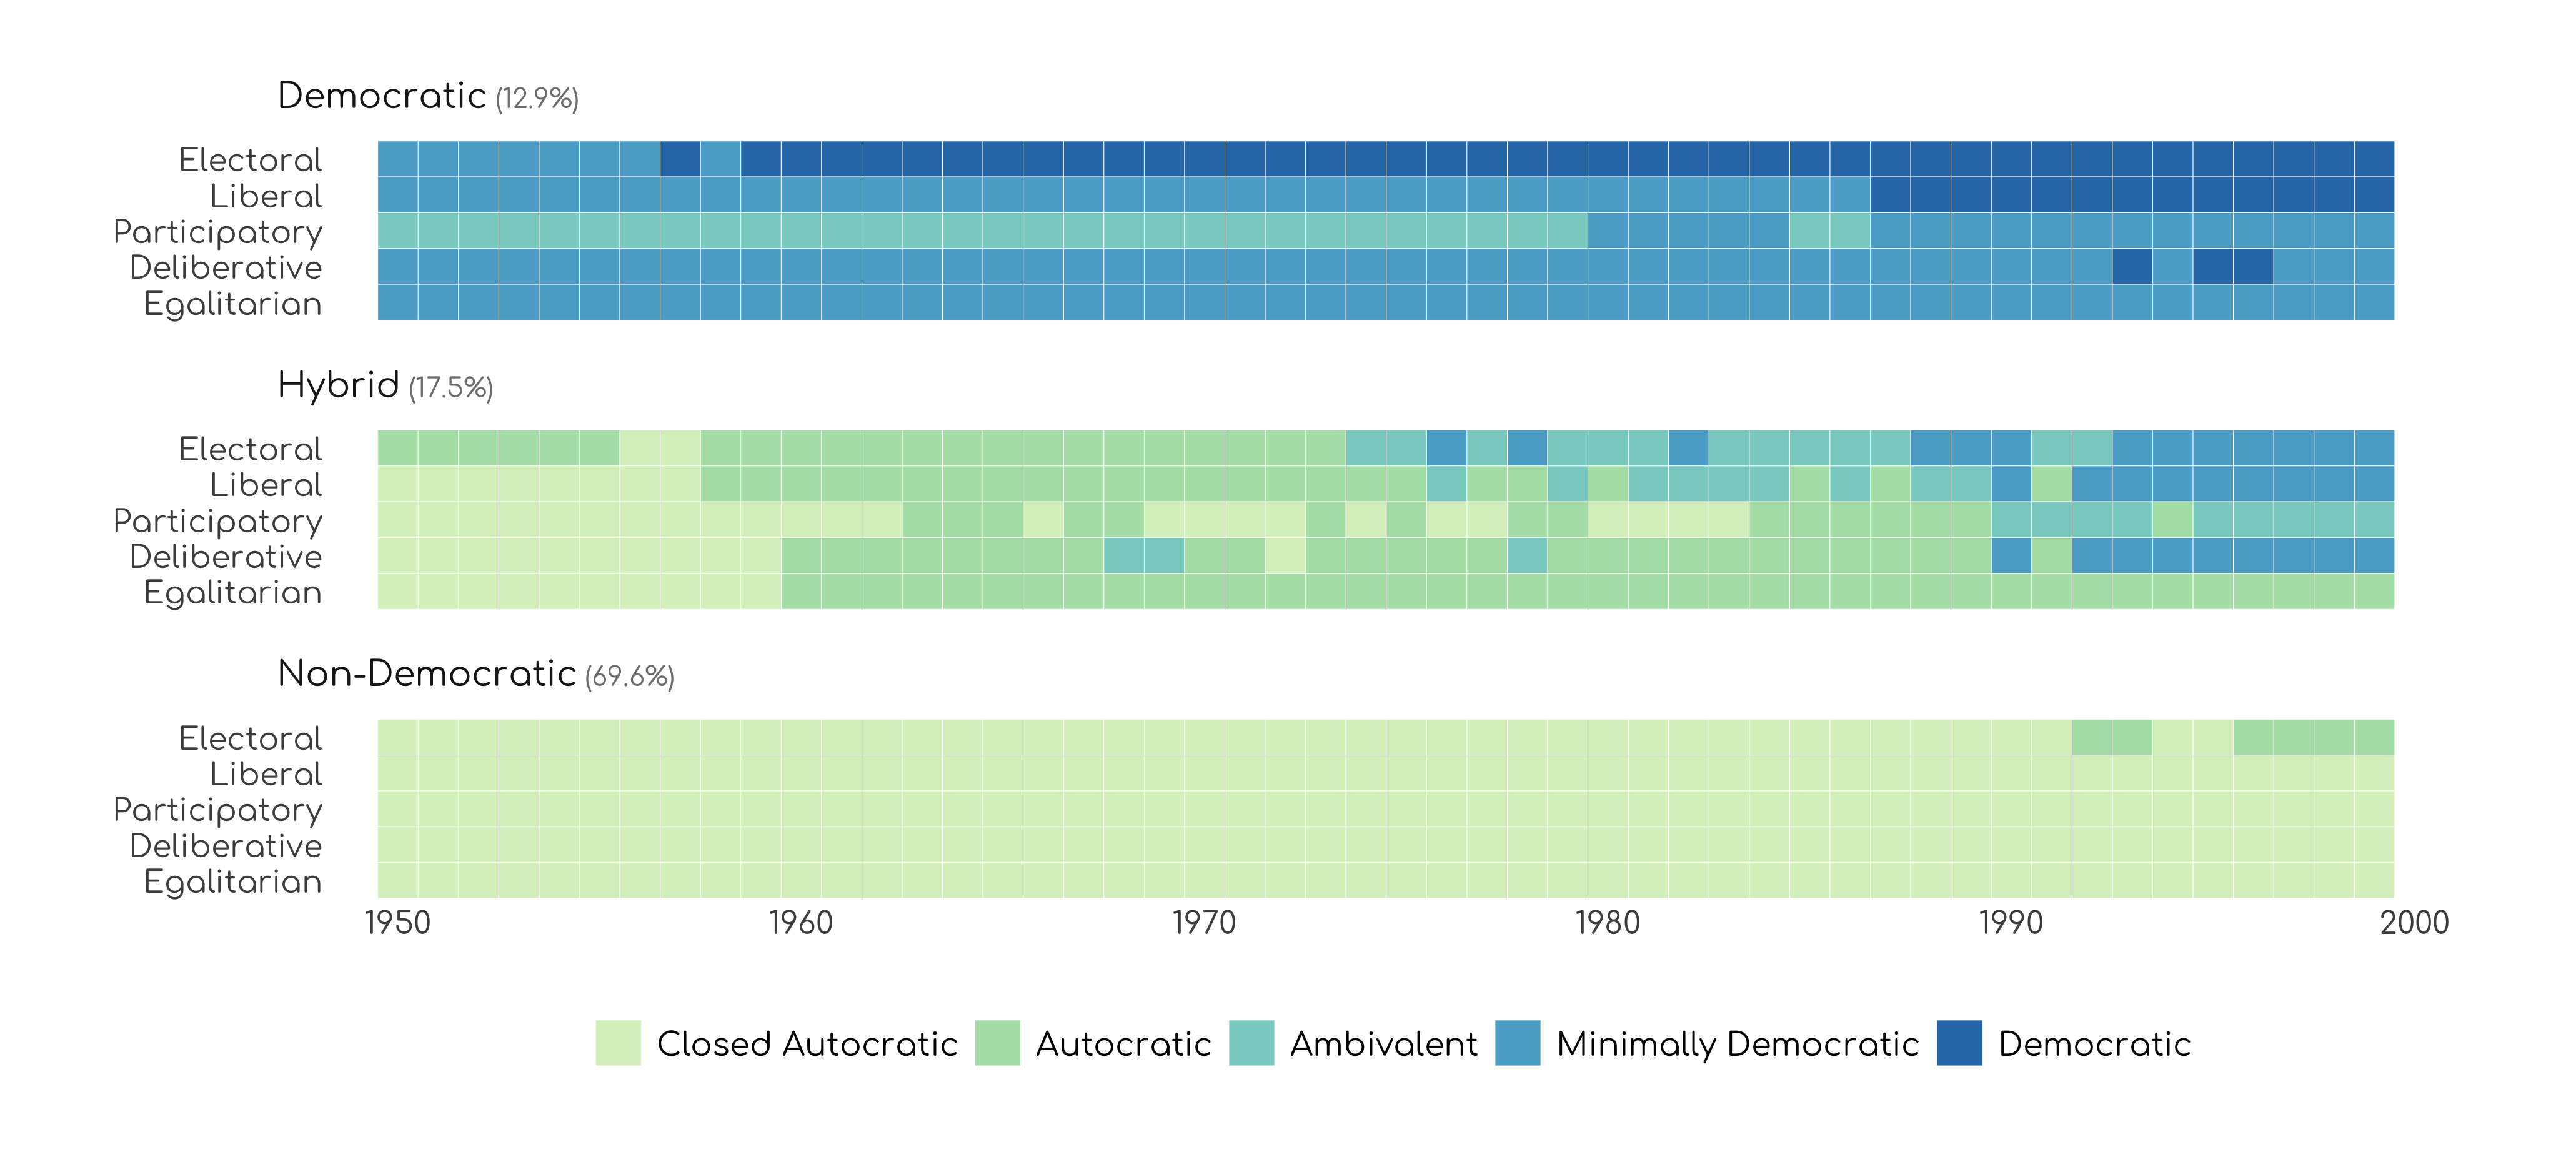
The Dangers of Nominalism
Some Preliminary Results—Two Data Points
| country | year | party | leader | far right typicality |
|---|---|---|---|---|


Do Not Condition on a Collider

Adaptation of Figure 5 from Elwert and Winship (2014)
Define Your Estimand

Figure 1 from Lundberg, Johnson and Stewart (2021)
References
Note: Scroll to access the entire bibliography

Abbott, Andrew. 1988. “Transcending General Linear Reality.” Sociological Theory 6(2):169–86. doi: 10.2307/202114.
Abbott, Andrew. 1995. “Sequence Analysis: New Methods for Old Ideas.” Annual Review of Sociology 21:93–113.
Elwert, Felix, and Christopher Winship. 2014. “Endogenous Selection Bias: The Problem of Conditioning on a Collider Variable.” Annual Review of Sociology 40(Volume 40, 2014):31–53. doi: 10.1146/annurev-soc-071913-043455.
Healy, Kieran Joseph. 2019. Data Visualization: A Practical Introduction. Princeton, NJ: Princeton University Press.
Karim, Sakeef M. 2024a. “Islam and the Transmission of Cultural Identity in Four European Countries.” Social Forces 103(2):756–79. doi: 10.1093/sf/soae076.
Karim, Sakeef M. 2024b. “The Organization of Ethnocultural Attachments Among Second- Generation Germans.” Social Science Research 118:102959. doi: 10.1016/j.ssresearch.2023.102959.
Lundberg, Ian, Rebecca Johnson, and Brandon M. Stewart. 2021. “What Is Your Estimand? Defining the Target Quantity Connects Statistical Evidence to Theory.” American Sociological Review 86(3):532–65. doi: 10.1177/00031224211004187.
McKinney, Wes. 2022. Python for Data Analysis: Data Wrangling with Pandas, NumPy, and Jupyter. 3rd Edition. Sebastopol, CA: O’Reilly.
Monk, Ellis P. 2022. “Inequality Without Groups: Contemporary Theories of Categories, Intersectional Typicality, and the Disaggregation of Difference.” Sociological Theory 40(1):3–27. doi: 10.1177/07352751221076863.
Soehl, Thomas, and Sakeef M. Karim. 2021. “How Legacies of Geopolitical Trauma Shape Popular Nationalism Today.” American Sociological Review 86(3):406–29. doi: 10.1177/00031224211011981.
Syrda, Joanna. 2023. “Gendered Housework: Spousal Relative Income, Parenthood and Traditional Gender Identity Norms.” Work, Employment and Society 37(3):794–813. doi: 10.1177/09500170211069780.
Wickham, Hadley, Mine Çetinkaya-Rundel, and Garrett Grolemund. 2023. R for Data Science: Import, Tidy, Transform, Visualize, and Model Data. 2nd edition. Sebastopol, CA: O’Reilly.
Wickham, Hadley, Danielle Navarro, and Thomas Lin Pedersen. 2025. ggplot2: Elegant Graphics for Data Analysis. 3rd Edition. New York: Springer.
Zhao, Linda. 2023. “From Superdiversity to Consolidation: Implications of Structural Intersectionality for Interethnic Friendships.” American Journal of Sociology 128(4):1114–57. doi: 10.1086/723435.